Chapter [ ]: Miscellaneous
ML Questions
What is the curse of dimensionality and how should one deal with it when building machine-learning models?
There are multiple phenomena referred to by this name in domains such as numerical analysis, sampling, combinatorics, machine learning, data mining, and databases. The common theme of these problems is that when the dimensionality increases, the volume of the space increases so fast that the available data become sparse. This sparsity is problematic for any method that requires statistical significance. In order to obtain a statistically sound and reliable result, the amount of data needed to support the result often grows exponentially with the dimensionality. Also organizing and searching data often relies on detecting areas where objects form groups with similar properties; in high dimensional data however all objects appear to be sparse and dissimilar in many ways which prevents common data organization strategies from being efficient.
The curse of dimensionality is dealt with by either using dimension reduction techniques (such as PCA and SVD) to greatly reduce the feature set or to avoid using models that are highly susceptible to it (such as K Nearest Neighbors).
How do you determine “k” for k-means clustering? Or, how do you determine the number of clusters in a data set?
Determining the number of clusters in a data set, a quantity often labeled k as in the k-means algorithm, is a frequent problem in data clustering, and is a distinct issue from the process of actually solving the clustering problem.
For a certain class of clustering algorithms (in particular k-means, k-medoids and expectation–maximization algorithm), there is a parameter commonly referred to as k that specifies the number of clusters to detect. Other algorithms such as DBSCAN and OPTICS algorithm do not require the specification of this parameter; hierarchical clustering avoids the problem altogether.
The correct choice of k is often ambiguous, with interpretations depending on the shape and scale of the distribution of points in a data set and the desired clustering resolution of the user. In addition, increasing k without penalty will always reduce the amount of error in the resulting clustering, to the extreme case of zero error if each data point is considered its own cluster (i.e., when k equals the number of data points, n). Intuitively then, the optimal choice of k will strike a balance between maximum compression of the data using a single cluster, and maximum accuracy by assigning each data point to its own cluster. If an appropriate value of k is not apparent from prior knowledge of the properties of the data set, it must be chosen somehow. There are several categories of methods for making this decision.
What’s more important: predictive power or interpretability of a model?
It depends on what you’re using it for. Sometimes you only care about making good predictions and don’t need interpretability; other times you need to know why your model is making the predictions it is.
Interpretability first:
- decline customer, you need explain why you decline them
- need report to the supervisor, they need understand your logic
- stable model
predictive power:
- in advertising, nobody cares about the process but the predicting power.
Explain finite precision. Why is finite precision a problem in machine learning?
Finite precision is decimal representation of a number which has been rounded or truncated. There many cases where this may be necessary or appropriate. For example 1/3 and the transcendental numbers ee and ππ all have infinite decimal representations. In the programming language C, a double value is 8 bit and precise to approximately 16 digits. See here.
To concretely represent one of these numbers on a (finite) computer there must be some sort of compromise. We could write 1/3 to 9 digits as .333333333 which is less than 1/3.
These compromises are compounded with arithmetic operations. Unstable algorithms are prone to arithmetic errors. This is why SVD is often used to compute PCA (instability of the covariance matrix).
In the naive bayes classifier, you will often see multiplication transformed into a sum of logarithms, which is less prone to rounding errors.
Explain the “bias-variance trade-off” and why it is fundamental to machine learning.
At its root, dealing with bias and variance is really about dealing with over- and under-fitting. Bias is reduced and variance is increased in relation to model complexity. As more and more parameters are added to a model, the complexity of the model rises and variance becomes our primary concern while bias steadily falls. For example, as more polynomial terms are added to a linear regression, the greater the resulting model's complexity will be3. In other words, bias has a negative first-order derivative in response to model complexity4while variance has a positive slope.
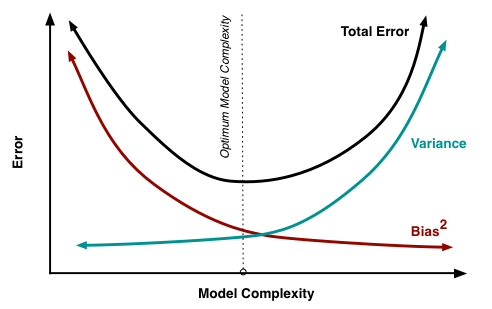
Bias and variance contributing to total error.
Understanding bias and variance is critical for understanding the behavior of prediction models, but in general what you really care about is overall error, not the specific decomposition. The sweet spot for any model is the level of complexity at which the increase in bias is equivalent to the reduction in variance.
If our model complexity exceeds this sweet spot, we are in effect over-fitting our model; while if our complexity falls short of the sweet spot, we are under-fitting the model. In practice, there is not an analytical way to find this location. Instead we must use an accurate measure of prediction error and explore differing levels of model complexity and then choose the complexity level that minimizes the overall error. A key to this process is the selection of an _accurate _error measure as often grossly inaccurate measures are used which can be deceptive. The topic of accuracy measures is discussed here but generally resampling based measures such as cross-validation should be preferred over theoretical measures such as Aikake's Information Criteria.
What subjects would you include in a one-day data science crash course? And why?
What are lift, KPI, robustness, model fitting, design of experiments, and the 80/20 rule?
KPI stands for Key Performance Indicator, or metric, sometimes called feature. A robust model is one that is not sensitive to changes in the data. Design of experiments or experimental design is the initial process used (before data is collected) to split your data, sample and set up a data set for statistical analysis, for instance in A/B testing frameworks or clinical trials. The 80/20 rules means that 80 percent of your income (or results) comes from 20 percent of your clients (or efforts).
What are collaborative filtering, n-grams, Map Reduce, and cosine distance?
Collaborative filtering/recommendation engines are a set of techniques where recommendations are based on what your friends like, used in social context networks. N-grams are token permutations associated with a keyword, for instance “car insurance California,” “California car insurance,” “insurance California car,” and so on. Map Reduce is a framework to process large data sets, splitting them into subsets, processing each subset on a different server, and then blending results obtained on each. Cosine distance measures how close two sentences are to each other, by counting the number of terms that their share. It does not take into account synonyms, so it is not a precise metric in NLP (natural language processing) contexts. All of these problems are typically solved with Hadoop/Map-Reduce, and the reader should check the index to find and read our various discussions on Hadoop and Map-Reduce in this book.
What is probabilistic merging (aka fuzzy merging)? Is it easier to handle with SQL or other languages? Which languages would you choose for semi-structured text data reconciliation?
You do a join on two tables A and B, but the keys (for joining) are not compatible. For instance, on A the key is first name/lastname in some char set; in B another char set is used. Data is sometimes missing in A or B. Usually, scripting languages (Python and Perl) are better than SQL to handle this.
Toad or Brio or any other similar clients are quite inefficient to query Oracle databases. Why? What would you do to increase speed by a factor 10 and be able to handle far bigger outputs?
Why is Naive Bayes so bad? How would you improve a spam detection algorithm that uses Naïve Bayes?
It assumes features are not correlated and thus penalize heavily observations that trigger many features in the context of fraud detection. Solution: use a solution such as hidden decision trees (described in this book) or decorrelate your features.
Can you perform logistic regression with Excel and if so, how, and would the result be good?
Yes; by using linest on log-transformed data.
Define quality assurance, six sigma, and design of experiments. Give examples of good and bad designs of experiments.
What are the drawbacks of general linear model? Are you familiar with alternatives (Lasso, ridge regression, and boosted trees)?
Linear models are models formulated via linear-algebra curve fitting, aka linear, or least-squares regression.
General linear models are ones where you use linear regression to find parameters of several Ys as functions of several Xs.
Although a very useful framework, there are some situations where general linear models are not appropriate
- the range of Y is restricted (e.g. binary, count)
- the variance of Y depends on the mean
Generalized linear models, aka glm, are ones where you fit a least-squares regression into data where residuals of a linear regression would have ended up non-normally distributed.
Do you think 50 small decision trees are better than 1 large one? Why?
It depends. There is enough variability in the data to produce 50 significantly different trees? If there isn't variability between the trees, then maybe you do not need a huge amount of them or you don't need them at all.
Depending on the ensemble type, typically an ensemble of weak learners yields better results than a single "large" model, because:
- You are typically less prone to overfit
- You average out model bias
Also, if you have large amounts of data maybe is not feasible to process all of the observations in a single model.
However you will probably lose interpretability when doing an ensemble. But this will depend on your objective.
Bottom line: You should always test your solutions with some appropriate fitness measure for your problem, using, in the case of predictive modeling, some out of sample dataset. Typically an ensemble is better, but in my opinion one must be careful about preconceived ideas.
Give examples of data that does not have a Gaussian distribution or log-normal. Give examples of data that has a chaotic distribution.
Salary distribution is a typical examples. Multimodal data (modeled by a mixture distribution) is another example.
Why is mean square error a bad measure of model performance? What would you suggest instead?
It puts too much emphasis on large deviations.
The MSE has the units squared of whatever is plotted on the vertical axis. The RMSE is directly interpretable in terms of measurement units, and so is a better measure of goodness of fit than a correlation coefficient. One can compare the RMSE to observed variation in measurements of a typical point. The two should be similar for a reasonable fit.
One case where MSE will be a bad measure is those cases where linear regression's assumptions are violated.
For some illustrative bivariate cases, see
MSE will be a bad measure in any case but set 1. This is because MSE will be the same in all 4 cases. In set 2, there is a model that fits perfectly, but is not linear. In set 3 there is a model that fits perfectly, if one point is deleted. In set 4, no model will fit at all except for one point.
If you do have data like this, one often overlooked method is quantile regression.
What is an efficiency curve? What are its drawbacks, and how can they be overcome?
What is an exact test? How and when can simulations help when you do not use an exact test?
What is the computational complexity of a good, fast clustering algorithm? What is a good clustering algorithm? How do you determine the number of clusters? How would you perform clustering on 1 million unique keywords, assuming you have 10 million data points—each one consisting of two keywords, and a metric measuring how similar these two keywords are? How would you create this 10 million data points table?
Answer: Found in Chapter 2, “Why Big Data Is Different.”
General Questions
Should click data be handled in real time? Why? In which contexts?
In many cases, real-time data processing is not necessary and even undesirable as end-of-day algorithms are usually much more powerful. However, real-time processing is critical for fraud detection, as it can deplete advertiser daily budgets in a few minutes.
What is better: good data or good models? And how do you define good? Is there a universal good model? Are there any models that are definitely not so good?
There is no universal model that is perfect in all situations. Generally speaking, good data is better than good models, as model performance can easily been increased by model testing and cross-validation. Models that are “too good to be true” usually are - they might perform very well on test data (data used to build the model) because of over-fitting, and very badly outside the test data.
How do you handle missing data? What imputation techniques do you recommend?
There are a lot of techniques to treat missing value. Here are the commonly used methods:
Ignore the records with missing values. Many tools ignore records with missing values. When the percentage of records with missing values is small, we could ignore those records.
Substitute a value such as mean. When the percentage is large and also when it makes sense to do something to avoid bias modeling results, substituting a value (e.g. mean, median) is a commonly used way. But this method could cause bias distribution and variance. That’s where the following imputation methods come in.
Predict missing values. Depending on the type of the imputed variable (i.e. continuous, ordinal, nominal) and missing data pattern (i.e. monotone, non-monotone), below are a few commonly used models.
- Logistic Regression
- Discriminant Regression
- Markov Chain Monte Carlo (MCMC)
- Predict missing values - Multiple Imputation. Although there are pros & cons, MI is considered to be superior to single imputation, and it better measures the uncertainty of the missing values. In addition, there are a few required statistical assumptions for multiple imputation:
- Whether the data is missing at random (MAR).
- Multivariate normal distribution, for some of the modeling methods mentioned above (e.g. regression, MCMC).
At last, if you have to think of what to report-
- The type of imputation algorithm used.
- Some justification for choosing a particular imputation method.
- The proportion of missing observations.
- The number of imputed datasets (m) created.
- The variables used in the imputation model.
Compare R and Python.
If you understand the underlying concepts behind what you’re doing, then you can use either language to perform your analysis.
For example, if you understand the principles of natural language processing, data cleaning, and machine learning, you can implement an automated text summarizer in R or Python.
As time goes on, data analysis in R and Python is becoming more similar as great packages like pandas, rvest, and ggplot bring concepts from one language into the other.
Given that, for most cases, I would use whatever language you’re most familiar with. Here are some main points of differentiation between the languages to be aware of, though:
R has a much bigger library of statistical packages
If you’re doing specialized statistical work, R packages cover more techniques. You can find R packages for a wide variety of statistical tasks using the CRAN task view. R packages cover everything from Psychometrics to Genetics to Finance. Although Python, through SciPy and packages like statsmodels, covers the most common techniques, R is far ahead.
Python is better for building analytics tools
R and Python are equally good if you want to find outliers in a dataset, but if you want to create a web service to enable other people to upload datasets and find outliers, Python is better. Python is a general purpose programming language, which means that people have built modules to create websites, interact with a variety of databases, and manage users.
In general, if you want to build a tool or service that uses data analysis, Python is a better choice.
R builds in data analysis functionality by default, whereas Python relies on packages
Because Python is a general purpose language, most data analysis functionality is available through packages like NumPy and pandas. However, R was built with statistics and data analysis in mind, so many tools that have been added to Python through packages are built into base R.
Python is better for deep learning
Through packages like Lasagne, caffe, keras, and tensorflow, creating deep neural networks is straightforward in Python. Although some of these, like tensorflow, are being ported to R, support is still far better in Python.
Python relies on a few main packages, whereas R has hundreds
In Python, sklearn is the “primary” machine learning package, and pandasis the “primary” data analysis package. This makes it easy to know how to accomplish a task, but also means that a lot of specialized techniques aren’t possible.
R, on the other hand, has hundreds of packages and ways to accomplish things. Although there’s generally an accepted way to accomplish things, the lines between base R, packages, and the tidyverse can be fuzzy for inexperienced folks.
R is better for data visualization
Packages like ggplot2 make plotting easier and more customizable in R than in Python. Python is catching up, particularly in the area of interactive plots with packages like Bokeh, but has a way to go.
The bottom line
Performing data analysis tasks in either language is more similar than you might expect. As long as you understand the underlying concepts, pick the language that you’re most familiar with.
R has an edge in statistics and visualization, whereas Python has an advantage in machine learning and building tools.
What is the curse of big data?
What are examples in which Map Reduce does not work? What are examples in which it works well? What is the security issues involved with the cloud?
The reader will find more information about key players in this market, in the section “The Big Data Ecosystem” in chapter 2, and especially in the online references (links) provided in this section.
What is sensitivity analysis? Is it better to have low sensitivity (that is, great robustness) and low predictive power, or vice versa? How to perform good cross-validation? What do you think about the idea of injecting noise in your data set to test the sensitivity of your models?
Compare logistic regression with decision trees and neural networks. How have these technologies been vastly improved over the last 15 years?
How would you define and measure the predictive power of a metric?
It depends on the underlying task and speaking generalities is not very useful. If your metric is the mean, then the standard error of the mean allows you to define confidence intervals. If you are doing linear regression then you have your correlation. If you are dealing with a binary predictor model, then you are concerned with Type I and Type II errors and an ROC Curve might help you understand the power of the model. In some cases you have theoretical values, and in other cases you can rely on things like bootstrapping or crossvalidation.
If you define "predictive power" to be the accuracy of a metric's success at predicting the empirical, they are all domain-specific. However, what matters is how easy it is to observe the prediction.
In fields like manufacturing, where failure rates of tools are easily observable, a model or a metric can be trained and the success rate can be easily measured as deviation over time from the observed.
In information security and in security (really any field with near-misses), it is nearly impossible to observe predictive power. After all, if I tell you an attack is coming and you should do X, did my recommendation stop the attack or was the attack never coming? This is the fundamental issue with a lack of observations, and we attempt to correlate a metric to outside data sources, similar situations, or apply the models to past data sets to see how effective they are.
Give a few examples of best practices in data science.
- Soft Skills Best Practices When Working On A Data Science Project
- Consult
- Understand the business problem
- Understand the stakeholders
- Understand your STARS situation
- Communicate
- Explain what you are doing and why
- Explain the caveats in interpreting what you are doing
- Always focus on the business problem
- Continuously validate the above
- Budget and Plan
- Clearly set out your approach, milestones and deliverables
- Measure progress and adjust when going off track or moving in a new direction
- Consult
- Technical Skills Best Practices When Working On A Data Science Project
- Operations
- Keep Everything (Principle 1: Space is cheap, confusion is expensive)
- Keep It Simple (Principle 2: Prefer simple, visual project structures and conventions)
- Automate (Principle 3: Prefer automation with program code )
- Maintain Data Provenance (Principle 4 Maintain a link between data on the file system, data in the analytics environment, and data in work products)
- Version Control Data and Code (Principle 5: Version control changes to data and analytics code)
- Consolidate (Principle 6: Consolidate team knowledge in version-controlled builds)
- Think like a developer (Principle 7: Prefer analytics code that runs from start to finish)
- Testing
- Test data with the 5 Cs of Data Quality. Completeness, Correctness, Consistency, Coherence and aCountability.
- Test code. Take a risk based approach to small, medium and large tests to improve confidence in the correctness of data manipulations, data cleaning and the application of business rules.
- Test models. Always reviews the standard tests that accompany a model or algorithm. Run models against new data to make sure they perform.
- Operations
What could make a chart misleading, or difficult to read or interpret? What features should a useful chart have?
Compressed scales that don't start at 0 make variations in line charts seem more dramatic than they really are.
Gratuitous 3D effects add visual "noise" and make the data harder to read.
Bright, saturated colors will make those elements more dominant than other elements -- this can either be constructive (helps the user focus on what's important) or misleading (distracting the viewer from the real issue).
If you emphasize everything, you've emphasized nothing, and just made your chart ugly. Be a minimalist -- follow Edward Tufte's "minimal effective difference" principle.
In your opinion, what is data science? Machine learning? Data mining?
What is the life cycle of a data science project?
How do you measure yield (over base line) resulting from a new or refined algorithm or architecture?
What is cross-validation? How to do it right?
So, you have an ML task with training data, which has, say, 10000 training points. You formulate the task as an optimization problem, which has some hyperparameters. The best set of values of these hyperparameters is one which gives the best error onunseen data. So, you can use validation — split the data into 8000 + 2000. Fix values of the hyperparameters, solve the resulting problem on 8000 points, and then predict on the 2000 points. The setting of hyperparameters that does the best is chosen, and we hope that these parameters would do well on new data, other than these 10000 points. The assumption here is that your held-out validation set of 2000 points is similar to any unseen data. While is this usually fine, there is always a chance that a suboptimal set of hyperparameter values fits your validation set well, and gives a better accuracy than actual unseen data, outside of these 10000 points.
Therefore, you want a more robust way to compare different settings of hyperparameters. So, instead of dividing the data into 8000 + 2000, you split your data into 5 equal parts of 2000 points each. Then, for any hyperparameter setting, you train your model on parts 2, 3, 4, 5 and test on 1, train on parts 1,3, 4, 5 and test on 2, train on parts 1, 2, 4, 5, etc., thereby getting 5 accuracies. Then, the performance of the model for this setting of hyperparameters is the average of these accuracies. This ensures that the procedure is not affected too much by random variations in the validation set. This process is called 5-fold cross validation. If you divide your training data into k-folds, you’re performing k-fold cross validation.
Is it better to design robust or accurate algorithms?
In development, there are tons of trade offs. Do you want your code to be faster when loading or faster when running? Do you want it to use less memory, or less time?
The answers to the questions might include a “usually” and there’s often an implied “both would be great, if we can do it.” But I would be surprised to find “always” in there.
If software is deciding whether to drop a bomb from an aircraft, I want it to be super-accurate, and also want it to err on the side of not blowing things up.
But with a voice recognition system, I want it to try to understand more speech, even if it errs a bit.
How to optimize algorithms (ie. parallel processing and/or faster algorithm: provide examples for both)
Examples of NoSQL architecture?
How to very efficiently cluster 100 billion web pages, for instance with a tagging or indexing algorithm?
How do you clean data?
How to turn unstructured data into structured data?
How do you define / select metrics? Have you designed and used compound metrics?
Examples of bad and good visualizations?
How do you assess the statistical significance of an insight?
If you were interviewing a data scientist, what questions would you ask him or her?
Explain what regularization is and why it is useful. What are the benefits and drawbacks of specific methods, such as ridge regression and LASSO?
Explain what a local optimum is and why it is important in a specific context, such as k-means clustering. What are specific ways for determining if you have a local optimum problem? What can be done to avoid local optima?
Assume you need to generate a predictive model of a quantitative outcome variable using multiple regression. Explain how you intend to validate this model.
Explain what precision and recall are. How do they relate to the ROC curve?
Explain what a long tailed distribution is and provide three examples of relevant phenomena that have long tails. Why are they important in classification and prediction problems?
What is latent semantic indexing? What is it used for? What are the specific limitations of the method?
Latent semantic indexing (LSI) is an indexing and retrieval method that uses a mathematical technique called singular value decomposition (SVD) to identify patterns in the relationships between the terms and concepts contained in an unstructured collection of text. LSI is based on the principle that words that are used in the same contexts tend to have similar meanings. A key feature of LSI is its ability to extract the conceptual content of a body of text by establishing associations between those terms that occur in similar contexts).
Limitations
The computational cost of the SVD is significant; at the time of this writing, we know of no successful experiment with over one million documents. This has been the biggest obstacle to the widespread adoption to LSI. One approach to this obstacle is to build the LSI representation on a randomly sampled subset of the documents in the collection, following which the remaining documents are ``folded in''.
LSI works best in applications where there is little overlap between queries and documents.
Most notably (and perhaps obviously), LSI shares two basic drawbacks of vector space retrieval: there is no good way of expressing negations (find documents that contain german but not shepherd), and no way of enforcing Boolean conditions.
Since it is a distributional model, so not an efficient representation, when compared against state-of-the-art methods (say deep neural networks).
1) Since it is a distributional model, so not an efficient representation, when compared against state-of-the-art methods (say deep neural networks).
2) Representation is dense, so hard to index based on indvidual dimensions.
3) It is a linear model, so not the best solution to handle non linear dependencies
4) The latent topic dimension can not be chosen to arbitrary numbers. It depends on the rank of the matrix, so can't go beyond that.
5) The model is not humanly readable. Debug/evaluation is possible through finding similar words for each word in the latent space though. But otherwise not easy to interpret like, say LDA
6) Deciding on the number of topics is based on heuristics and needs some expertise. Conventional solution is to sort the cumulative singular values in descending order and finding a cut (say x% of total value).
What is the Central Limit Theorem? Explain it. Why is it important? When does it fail to hold?
The central limit theorem shows that under certain conditions, the sum of a sequence of random variables will have approximately a normal distribution. In the simplest version the random variables are independent and identically distributed and have finite variance.
This version implies that the mean of a large sample will have a normal distribution. It is important because it allows probability statements to be made about the mean even if the distribution of the raw data is unknown.
Strictly speaking, finite variance is an important condition, but in practice all real data is finite. Under these conditions the theorem never fails to hold. However, if the sampled distribution has a long tail, the theorem is unhelpful because a sufficiently large sample for normality would be impractical.
You should never rely on the normal distribution; always check that there are no outliers and the sampled distribution is not too skewed or have long tails.
The more general version of the theorem suggests that the sampled distribution, especially natural biological populations, is often approximately normal because variation is the total of many small effects. But you should not rely on this—there are too many ways for it to fail.
Explain what resampling methods are and why they are useful. Also explain their limitations.
Explain the differences between artificial neural networks with softmax activation, logistic regression, and the maximum entropy classifier.
Provide a simple example of how an experimental design can help answer a question about behavior. For instance, explain how an experimental design can be used to optimize a web page. How does experimental data contrast with observational data.
Is mean imputation of missing data acceptable practice? Why or why not?
What is an outlier? Explain how you might screen for outliers and what you would do if you found them in your dataset. Also, explain what an inlier is and how you might screen for them and what you would do if you found them in your dataset.
An outlier is an observation that appears to deviate markedly from other observations in the sample.
The following are a few of the more commonly used outlier tests for normally distributed data. This list is not exhaustive (a large number of outlier tests have been proposed in the literature). The tests given here are essentially based on the criterion of "distance from the mean". This is not the only criterion that could be used. For example, the Dixon test, which is not discussed here, is based a value being too large (or small) compared to its nearest neighbor.
- Grubbs' Test - this is the recommended test when testing for a single outlier.
- Tietjen-Moore Test - this is a generalization of the Grubbs' test to the case of more than one outlier. It has the limitation that the number of outliers must be specified exactly.
- Generalized Extreme Studentized Deviate (ESD) Test - this test requires only an upper bound on the suspected number of outliers and is the recommended test when the exact number of outliers is not known.
An inlier is a data value that lies in the interior of a statistical distribution and is in error. Because inliers are difficult to distinguish from good data values they are sometimes difficult to find and correct. A simple example of an inlier might be a value in a record reported in the wrong units, say degrees Fahrenheit instead of degrees Celsius.
Methodology to detect outliners/inliers
What is principal components analysis (PCA)? Explain the sorts of problems you would use PCA for. Also explain its limitations as a method.
Principal components analysis is a method of dimension reduction for data sets with a lot of variables. It basically makes linear combinations of the variables in ways that extract as much variance as possible.
I think it is often misused when either factor analysis or partial least squares would be better, but it often gives similar results to factor analysis so the harm is not great.
However, PCA can be useful in exploring large data sets to see the structure of the relationships among variables when a correlation matrix would be overwhelming. Also, unlike correlation, it allows for relationships among sets of variables, rather than just pairs.
Sometimes PCA doesn’t work. If the variables are all very uncorrelated, PCA may not be very useful.